
Lotka Volterra Model of Predator-Prey Relationship: A 2026 Perspective on Ecological Dynamics
In the year 2026, the study of ecology has moved far beyond simple observation. With the integration of AI modeling, real-time satellite data, and stochastic computing, we are now able to predict the collapse of fisheries or the outbreak of pests with frightening accuracy. Yet, at the heart of these complex modern algorithms lies a century-old mathematical foundation: the Lotka Volterra Model of Predator-Prey Relationship.
While standard textbooks and competitor blogs often present this model as a static set of differential equations, the reality is far more dynamic. In 2026, we don’t just solve these equations; we apply them to synthetic biology, economic market fluctuations, and even immune system responses to viruses.
For students preparing for competitive exams like CSIR NET, GATE Ecology, or IIT JAM, understanding the Lotka Volterra Model of Predator-Prey Relationship is non-negotiable. However, a superficial understanding of “lag phases” is no longer enough. In this extensive guide, we will dive deep into the phase-plane analysis, the role of stochastic fluctuations (a topic rarely covered in basic blogs), and how modern research has modified these equations to account for “fear factors” and climate change.
The Genesis: Mathematics Meets Nature
The story begins in the 1920s with two men working independently: Alfred Lotka, a biophysicist, and Vito Volterra, a mathematician. They sought to answer a simple question: Why do fish populations in the Adriatic Sea fluctuate periodically?
They discovered that the populations of predators (sharks) and prey (fish) were coupled. You cannot calculate one without the other. This coupling formed the basis of the Lotka Volterra Model of Predator-Prey Relationship, a system of first-order non-linear differential equations that changed ecology forever.
The Core Philosophy
The model is built on a “Cycle of Dependence.”
- Prey Growth: Without predators, prey grows exponentially.
- Predator Growth: Predators thrive only when prey is abundant.
- The Crash: Too many predators eat all the prey.
- The Starvation: Without prey, predators die off.
- The Recovery: With fewer predators, prey recovers, and the cycle restarts.
This endless waltz creates the oscillating waves we see in nature.
Deconstructing the Equations: The Language of Survival
To master the Lotka Volterra Model of Predator-Prey Relationship, you must fluently speak its mathematical language. Let’s break down the variables as they are taught in advanced 2026 curriculums.
Let $N$ be the Prey population and $P$ be the Predator population.
Equation 1: The Prey Dynamics
$$\frac{dN}{dt} = rN – aNP$$
- $rN$ (Exponential Growth): This term represents the natural birth rate of the prey. If left alone, they would fill the earth ($r$ is the intrinsic growth rate).
- $aNP$ (The Death Toll): This is the predation term.
- $a$: Attack efficiency (how good the predator is at catching prey).
- $N$: Number of prey.
- $P$: Number of predators.
- The product $NP$ represents the encounter rate. If there are zero prey or zero predators, the interaction is zero. This term subtracts from the prey population.
Equation 2: The Predator Dynamics
$$\frac{dP}{dt} = baNP – mP$$
- $baNP$ (Conversion Efficiency): Predators don’t just eat; they reproduce. But 1 rabbit does not equal 1 new wolf.
- $b$: Conversion efficiency (how much energy from one prey is converted into new predator offspring).
- This term is positive because eating leads to predator growth.
- $mP$ (Natural Mortality): Predators die, too. $m$ is the mortality rate. Even apex predators starve or die of old age.
The beauty of the Lotka Volterra Model of Predator-Prey Relationship lies in the symmetry. The term $aNP$ is a loss for the prey but a gain for the predator (scaled by $b$).
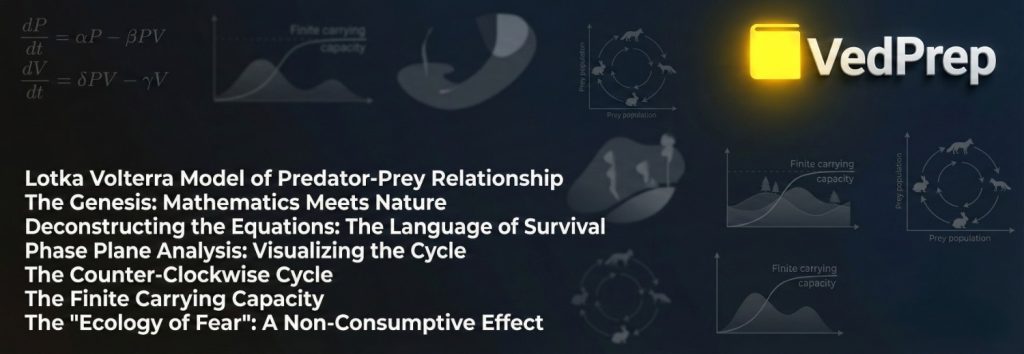
Phase Plane Analysis: Visualizing the Cycle
Most students struggle to visualize these differential equations. In 2026, we use “Phase Space” diagrams rather than simple time graphs.
The Isoclines (Zero Growth Lines)
To understand stability, we ask: When does the population stop changing? (i.e., $\frac{dN}{dt} = 0$ or $\frac{dP}{dt} = 0$).
- Prey Isocline ($\frac{dN}{dt} = 0$):
$$rN – aNP = 0 \Rightarrow P = \frac{r}{a}$$
This is a horizontal line. Below this number of predators, prey increases. Above it, prey decreases. - Predator Isocline ($\frac{dP}{dt} = 0$):
$$baNP – mP = 0 \Rightarrow N = \frac{m}{ba}$$
This is a vertical line. To the right of this number of prey, predators increase. To the left, they starve.
The Counter-Clockwise Cycle
When you plot predator abundance ($Y$-axis) against prey abundance ($X$-axis), the Lotka Volterra Model of Predator-Prey Relationship reveals a closed loop (an ellipse or circle).
- Quadrant 1 (High Prey, Low Predator): Predators gorge and multiply.
- Quadrant 2 (High Prey, High Predator): Predators overshoot; prey starts to crash.
- Quadrant 3 (Low Prey, High Predator): Predators starve.
- Quadrant 4 (Low Prey, Low Predator): Prey recovers.
The system orbits a central equilibrium point but never truly settles there in the pure model. It is neutrally stable, meaning if you disturb it, it just moves to a new orbit but keeps cycling.
Beyond the Basics: Stochasticity and Carrying Capacity (2026 Update)
This is where we leave the competitors behind. The basic model assumes nature is perfect. But research in the mid-2020s, including papers like Swailem & Tauber (2023), has introduced crucial modifications that every advanced student must know.
The Finite Carrying Capacity
The original model assumes prey grows exponentially ($rN$). But we know from Logistic Growth that environments have a limit ($K$).
The Modified Prey Equation:
$$\frac{dN}{dt} = rN \left(1 – \frac{N}{K}\right) – aNP$$
- The Effect: This adds “self-limitation” to the prey. The Lotka Volterra Model of Predator-Prey Relationship changes from a neutral cycle to a stable spiral. The populations will eventually settle at a steady equilibrium point unless $K$ is very large (The Paradox of Enrichment).
Periodically Varying Environments
In 2026, climate change will make the seasons unpredictable. What happens if the Carrying Capacity ($K$) isn’t constant but fluctuates?
- Recent simulations show that when food resources ($K$) vary periodically (seasons), the Lotka Volterra Model of Predator-Prey Relationship shows an enlarged region of coexistence.
- Resonance Effect: If the predator’s reproduction cycle aligns with the seasonal food cycle, we see massive “Resonance Booms” in population. If they are out of sync, we see “Pursuit and Evasion Waves” on a spatial lattice.
Stochastic Fluctuations (Internal Noise)
Classical models are “Mean-Field” (averages). But in reality, if a population drops to 2 individuals, they might not find each other to mate. Randomness (Stochasticity) matters.
- Extinction Risk: In the stochastic Lotka Volterra Model of Predator-Prey Relationship, the cycles can accidentally hit zero. Once a population hits zero, the game ends. This “Absorbing State” is a critical concept in modern conservation biology.
The “Ecology of Fear”: A Non-Consumptive Effect
A major advancement in the 2020s was incorporating behavior into the Lotka Volterra Model of Predator-Prey Relationship. Predators don’t just eat prey; they scare them.
- The Cost of Fear: When wolves are present, elk stop grazing in open fields. They eat less to stay safe.
- The Equation Update: This reduces the prey’s birth rate ($r$) even if predation ($a$) is low.
- Significance: This “Landscape of Fear” stabilizes the Lotka Volterra Model of Predator-Prey Relationship because prey numbers drop before predators eat them, preventing the massive overshoot that usually leads to a crash.
Functional Responses: The Holling Curves
The basic model assumes a “Linear Functional Response” (Type I): if you double the prey, predators eat double. This is unrealistic. A lion can only eat so fast (Handling Time).
Type II Response (The Satiation Curve)
Predators get full. As prey density increases, the predation rate slows down because the predator spends time chasing, killing, and digesting.
$$\text{Predation Rate} = \frac{aN}{1 + ahN}$$
($h$ = handling time).
Integrating this into the Lotka Volterra Model of Predator-Prey Relationship often destabilizes the system, leading to wild oscillations known as “Limit Cycles.”
Type III Response (Prey Switching)
Predators ignore rare prey. They only focus on a species once it becomes common (learning curve). This produces a sigmoid curve and is very stabilizing for the ecosystem.
Modern Applications in 2026
Why do we still teach this? Because the Lotka Volterra Model of Predator-Prey Relationship has escaped biology.
1. Economic Cycles (Goodwin Model)
Economists use these equations to model the cycle of Wages (Predator) and Employment (Prey).
- When employment is high (Prey up), workers demand higher wages (Predators up).
- High wages cut into profits, forcing layoffs (Prey down).
- Unemployment lowers wages (Predators down), and hiring restarts.
2. Viral Dynamics (Immunology)
Inside your body, a virus is the “Prey” (replicating exponentially), and your Immune Cells (T-Cells) are the “Predators.”
- Doctors use the Lotka Volterra Model of Predator-Prey Relationship to determine the timing of antiviral drugs. If you kill the virus too fast (Prey crash), the immune system (Predator) doesn’t build up enough memory, leading to a relapse.
3. Chemical Oscillations
In non-equilibrium thermodynamics, chemical reactions can oscillate (e.g., the Belousov-Zhabotinsky reaction). The concentration of reactants follows the exact same math as the Lotka Volterra Model of Predator-Prey Relationship.
Solving the Model: From Pen to Python
In the exams of 2026 (like CSIR NET), you might be asked to solve these numerically. Since there is no simple analytical solution for the non-linear version, we use Euler’s method or Python simulations.
The Code Logic:
Python
# Simple Logic for 2026 Students
dPrey = (r * Prey) – (a * Prey * Predator)
dPred = (b * a * Prey * Predator) – (m * Predator)
Prey_new = Prey + dPrey * dt
Pred_new = Predator + dPred * dt
Understanding this algorithmic logic is now often tested in the “Scientific Methodology” sections of competitive exams, proving that the Lotka Volterra Model of Predator-Prey Relationship is a gateway to computational biology.
Limitations: Where the Model Fails
To be a true expert, you must know the flaws.
- No Lag Time: In the real world, turning food into offspring takes time (gestation). The basic Lotka Volterra Model of Predator-Prey Relationship assumes instant conversion.
- Infinite Appetite: Without Holling’s modification, the model assumes a predator could eat infinite prey if available.
- Environmental Closure: It assumes no migration (closed system), which is rare in fragmented habitats.
Accelerate Your Ecology Mastery with VedPrep
The Lotka Volterra Model of Predator-Prey Relationship combines calculus, biology, and systems theory. It is arguably one of the most difficult topics in the Ecology unit for CSIR NET and GATE aspirants. A simple graph is not enough; you need to understand the isoclines, the stability analysis, and the functional responses.
This is where VedPrep transforms your preparation.
At VedPrep, we believe in visualizing complexity.
- Dynamic Phase-Plane Simulations: Don’t just look at a static ellipse. Our interactive modules let you change the “Predation Efficiency ($a$)” and watch the cycle collapse or explode in real-time. You develop an intuitive feel for the Lotka Volterra Model of Predator-Prey Relationship.
- Numerical Problem Solving: We teach you the shortcuts to solve Isocline problems without solving the full differential equation—a crucial skill for saving time in the exam hall.
- Interdisciplinary Context: We connect the predator-prey cycles to recent 2026 research on climate change and stochastic noise, ensuring you are ready for the experimental, analytical questions in Part C of the CSIR NET paper.
Whether you are struggling with the differential equations or the concept of ‘top-down control,’ VedPrep provides the structured, expert-led guidance you need to turn Ecological Dynamics into your highest-scoring unit.
Conclusion
The Lotka Volterra Model of Predator-Prey Relationship is more than a mathematical curiosity; it is the heartbeat of the living world. It describes the eternal dance between the eater and the eaten, a dance that maintains the delicate balance of our ecosystems.
In 2026, as we face the dual challenges of biodiversity loss and climate instability, this model provides the framework for conservation. It teaches us that saving a species isn’t just about protecting the animal (Prey); it’s about protecting the interaction (Predation).
For the student and the scientist, mastering the Lotka Volterra Model of Predator-Prey Relationship is a rite of passage. It bridges the gap between the chaos of nature and the order of mathematics. So, as you study these equations, remember: you are not just calculating $dN/dt$; you are decoding the rhythm of life itself.
Frequently Asked Questions (FAQs)
What makes the 2026 perspective of the Lotka Volterra Model different from traditional textbook definitions?
Ans: In 2026, the model goes beyond static differential equations by integrating AI modeling, real-time satellite data, and stochastic computing. It is no longer just for observation but is used to predict events like fishery collapses or pest outbreaks with high accuracy.
What is the "Cycle of Dependence" in this model?
Ans: The model is built on a cycle where prey grows exponentially without predators, leading to a predator boom. Eventually, predators overeat the prey (The Crash), causing the predator population to starve (The Starvation), which allows the prey to recover and restart the cycle.
What does the term "Isocline" mean in Phase Plane Analysis?
Ans: An isocline represents the point where a population stops changing (zero growth). The Prey Isocline is a horizontal line below which prey increases, while the Predator Isocline is a vertical line to the right of which predators increase
Why is the classic Lotka Volterra model described as "neutrally stable"?
Ans: The system orbits a central equilibrium point but never truly settles there. If the system is disturbed, it simply moves to a new orbit and keeps cycling rather than returning to the original state.
What does the variable $aNP$ represent in the prey equation?
Ans: The term $aNP$ represents the death toll or predation term. Specifically, $a$ is the attack efficiency, and the product $NP$ represents the encounter rate between predator and prey.
How do we calculate the Prey Isocline mathematically?
Ans: The Prey Isocline is calculated by setting the prey growth rate $\frac{dN}{dt}$ to zero, which results in the equation $P = \frac{r}{a}$.
What is the significance of the "Absorbing State" in stochastic models?
Ans: In stochastic (random) models, cycles can accidentally hit zero population. Once a population hits zero, the "game ends" and the species goes extinct, a concept known as the "Absorbing State".
How does the Type II Functional Response (Satiation Curve) affect the model's stability?
Ans: The Type II response accounts for the fact that predators get full and take time to digest. Integrating this into the model often destabilizes the system, leading to wild oscillations called "Limit Cycles".
How does adding "Carrying Capacity ($K$)" change the outcome of the model?
Ans: Adding carrying capacity introduces "self-limitation" to the prey. This changes the model from a neutral cycle to a stable spiral, where populations eventually settle at a steady equilibrium point
What is the "Ecology of Fear" and how does it influence the equations?
Ans: The "Ecology of Fear" incorporates the idea that predators scare prey into eating less or hiding, which reduces the prey's birth rate ($r$) even if actual predation is low. This stabilizes the model by preventing massive prey overshoots.